 |
|
|
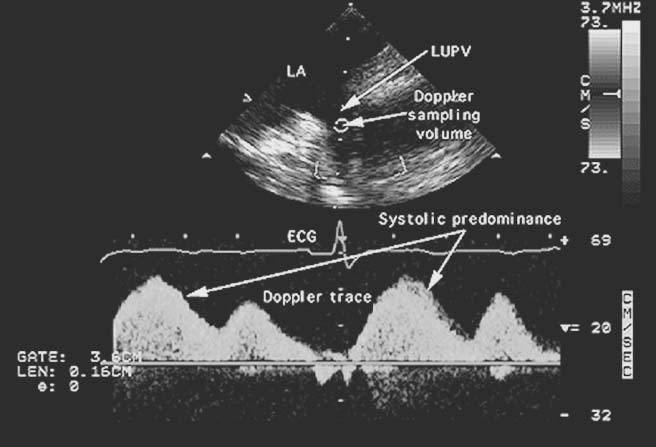
Figure 33-11
Normal pulmonary venous flow pattern. Pulsed-wave Doppler
measurement of normal blood flow velocities in the left upper pulmonary vein (LUPV)
is shown. At the top of the figure is a still-frame image of the two-dimensional
cross section used to position the Doppler sample volume (the round
white sphere). On the bottom two thirds of the figure is the display
in white of the instantaneous blood flow velocities (vertical axis) versus time (horizontal
axis) occurring in that sample volume. The electrocardiogram provides timing, and
the bold horizontal line is the baseline (zero flow)
for the flow velocities. Flow velocities above the red line
are positive (i.e., toward the transducer) to a maximum of 69 cm/sec. Flow below
the red line is negative (i.e., away from the transducer)
to a maximum of -32 cm/sec. In this patient with normal left atrial pressure, systolic
predominance of flow is evident; that is, more flow enters the atrium during the
period of ventricular systole than during ventricular diastole as evidenced by the
greater peak and average flow velocities during systole than during diastole. LA,
left atrium. (From Cahalan MK: Intraoperative Transesophageal Echocardiography.
An Interactive Text and Atlas. New York, Churchill Livingstone, 1997.)
|
|