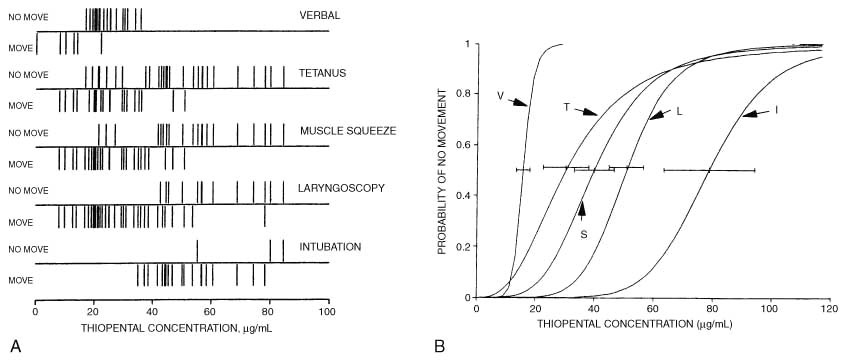
Figure 31-15
A, Move/no move versus
serum thiopental concentration for five different clinical stimuli. Each bar
indicates the serum thiopental concentration and response to stimuli applied to an
individual patient. B, Predicted probability of no
movement versus serum thiopental concentrations obtained by using logistic regression
of the data indicated in A. The bars
indicate the 95% confidence bounds of the estimate of serum thiopental concentration
that produces a 50% probability of no movement response. I, laryngoscopy/intubation;
L, laryngoscopy; S, trapezius muscle squeeze; T, tetanic nerve stimulation; V, verbal.
(From Hung OR, Varvel JR, Shafer SL, et al: Thiopental pharmacodynamics.
II. Quantitation of clinical and electroencephalographic depth of anesthesia. Anesthesiology
77:237, 1992.)