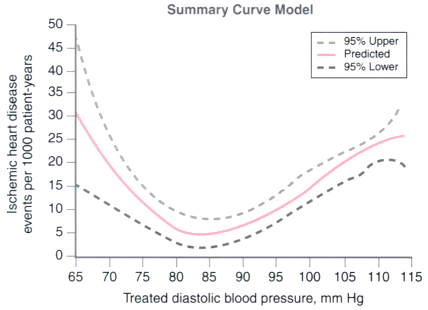
Figure 27-8
Studies that stratified cardiac events by treated diastolic
blood pressure levels. Ischemic Heart Disease Events is a combination of morbidity
and mortality. The summary curve was calculated by using a systematic decrease of
10 mm Hg in diastolic blood pressure levels. Surrounding dashed
curves show the 95% confidence intervals. (Redrawn from Farnett
L, Mulrow CD, Linn WD, et al: The J-curve phenomenon and the treatment of hypertension.
Is there a point beyond which pressure reduction is dangerous? JAMA 265:489, 1991.)

