|
|
|
|
|
|
|
|
|
|
|
|
|
|
|
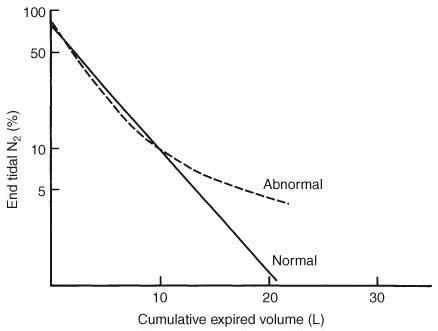
Figure 26-16
Schematic representation of multiple-breath nitrogen
washout curves in a young, healthy nonsmoker (Normal) and in an asymptomatic smoker
(Abnormal). Expired nitrogen concentration is plotted on a logarithmic scale against
cumulative expired volume during pure oxygen breathing.

|
|
|
|
|
|
|
|
|
|
|
|
|
|