|
|
|
|
|
|
|
|
|
|
|
|
|
|
|
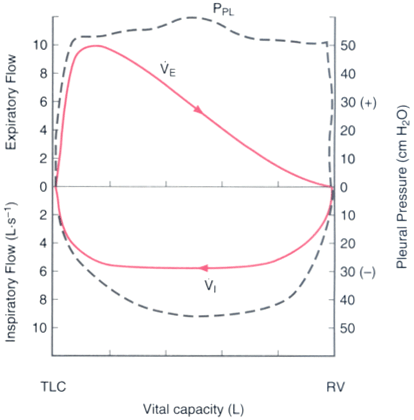
Figure 26-14
Schematic representation of a maximum inspiratory (V̇1
)
and expiratory (V̇E
) flow-volume loop in a normal subject. The pleural
pressure (PPL) associated with the maximum effort
is plotted as a function of lung volume from total lung capacity (TLC) to residual
volume (RV). V̇1
and V̇E
at the midpoint (50%) of
vital capacity are indicated by arrows.

|
|
|
|
|
|
|
|
|
|
|
|
|
|