|
|
|
|
|
|
|
|
|
|
|
|
|
|
|
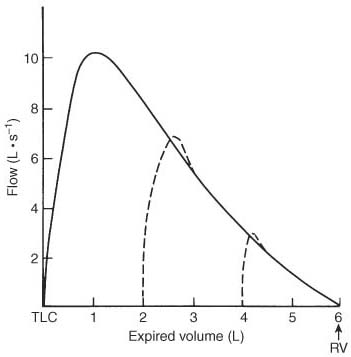
Figure 26-12
Maximum expiratory flow-volume curves before (solid
line) and after (broken lines) induced
bronchoconstriction. Flow is plotted against expired volume, which is expressed
in liters (L), from total lung capacity (TLC) to residual volume (RV).

|
|
|
|
|
|
|
|
|
|
|
|
|
|