|
|
|
|
|
|
|
|
|
|
|
|
|
|
|
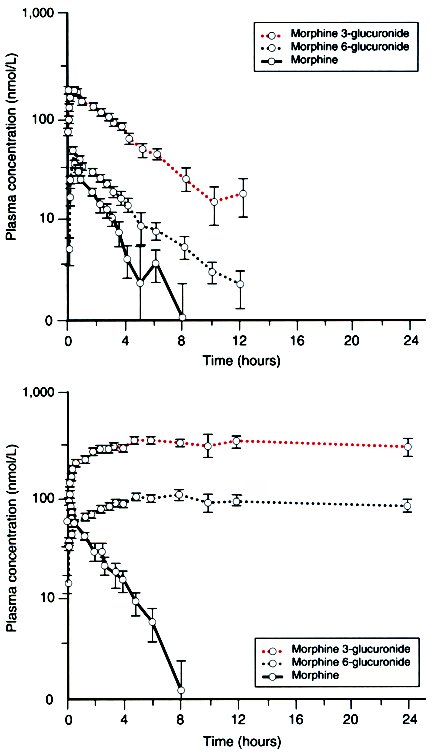
Figure 11-22
Effect of renal failure on pharmacokinetics of morphine.
The graphs show the time-dependent change of the serum concentration of morphine
and its metabolite in patients with normal renal function (top
graph) and patients with renal failure (bottom graph),
who received 0.1 mg/kg morphine IV. (From Osborne R, Joel S, Grebenik K,
et al: The pharmacokinetics of morphine and morphine glucuronides in kidney failure.
Clin Pharmacol Ther 54:158–167, 1993.)

|
|
|
|
|
|
|
|
|
|
|
|
|
|