 |
 |
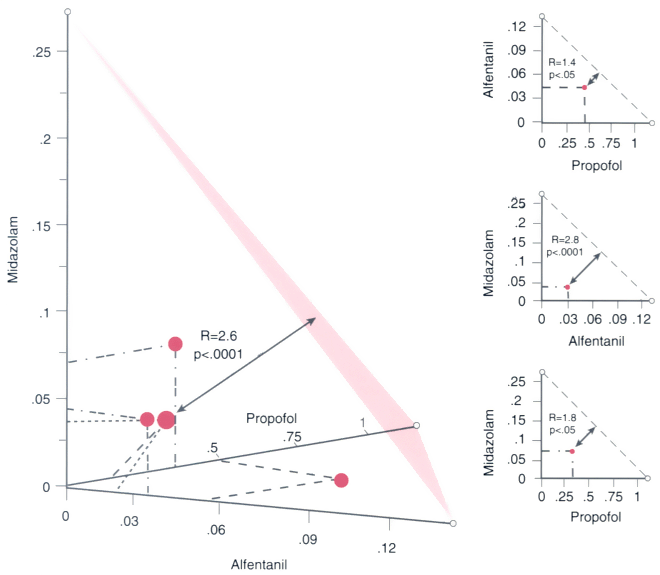
Figure 10-18
Vertical axes all represent drug dose in milligrams per
kilogram. On the right, median effective dose (ED50
)
isobolograms for the hypnotic interactions among midazolam, alfentanil, and propofol
are shown. The dotted lines are additive effect
lines; note that all combinations fall within the line representing synergism or
supra-additive effect. On the left, a triple interaction
is depicted. The shaded area represents an additive
plane passing through three single-drug ED50
points (small
open circles). The largest closed circle
(with arrows) is the ED50
point for the
triple combination. The smaller closed circles are
ED50
points for the binary combinations. R ratios on all graphs represent
the interaction (1.0 indicates an additive effect) of the various drug combinations.
Note that the combination of midazolam and alfentanil produces the greatest synergism,
but the combination of all three is also synergistic. P
values denote the significance of the additive effects. (Redrawn with modification
from Vinik HR, Bradley EL Jr, Kissin I: Triple anesthetic combination: Propofol-midazolam-alfentanil.
Anesth Analg 76:S450, 1993.)

 |
