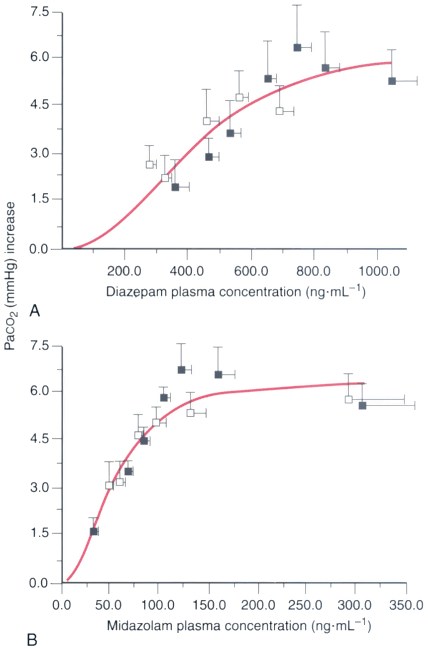
Figure 10-16
A, Increase in PaCO2
from baseline versus plasma concentration after three intravenous bolus doses of
diazepam (0.15 mg/kg) given at 20-minute intervals. B,
Increase in PaCO2
from baseline versus
the midazolam plasma concentration after three intravenous bolus doses of midazolam
(0.05 mg/kg) given at 20-minute intervals. The solid line
represents a best-fit model of the data from the three injections. Mean values are
represented as plus or minus standard error of the mean. (Redrawn from Sunzel
M, Paalzow L, Berggren L, Eriksson I: Respiratory and cardiovascular effects in
relation to plasma levels of midazolam and diazepam. Br J Clin Pharmacol 25:561–569,
1988.)

