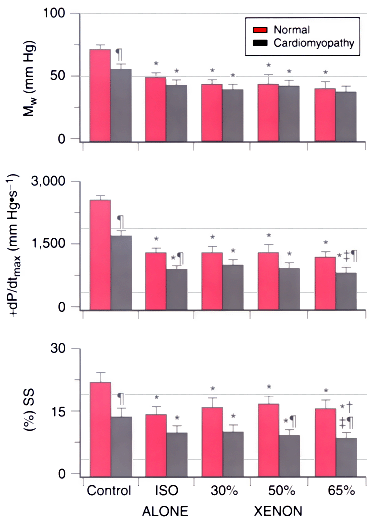
Figure 7-25
Histograms show the effects of isoflurane (ISO) and xenon
on the preload recruitable stroke work slope (MW
, top
panel), the peak rate of increase of left ventricular pressure (+dP/dtmax
,
middle panel), and percent segment shortening (%SS,
bottom panel) in normal (red
bars) and cardiomyopathic (gray bars)
dogs receiving 1.5 minimum alveolar concentration (MAC) of isoflurane in the presence
and absence of 30%, 50%, and 65% xenon. *, Significantly (P
< .05) different from control; †, significantly (P
< .05) different from ISO alone; ‡, significantly (P
< .05) different from ISO and 30% xenon; ¶, significantly (P
< .05) different from the corresponding value in normal dogs.

