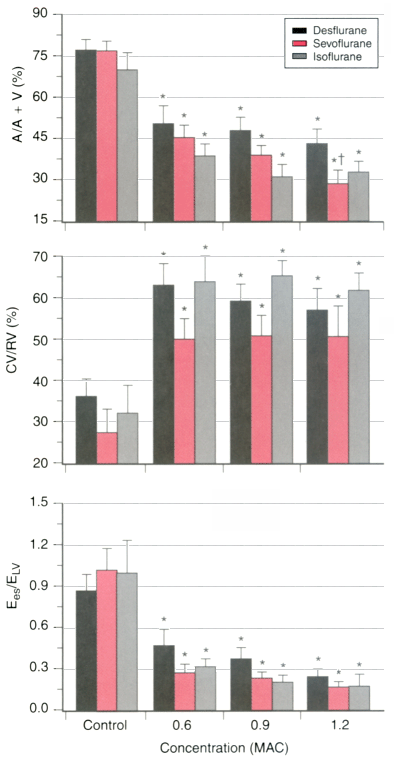
Figure 7-15
Histograms depict the ratio of the left atrial (LA) A
loop to the total pressure-volume diagram area (A/A+V, top panel),
the ratio of LA conduit to total reservoir volume (CV/RV, middle
panel), and LA-left ventricular coupling (Ees
/ELV
,
bottom panel) under baseline conditions (Control)
and during the administration of 0.6, 0.9, and 1.2 minimum alveolar concentrations
(MACs) of desflurane (black bars), sevoflurane (red
bars), or isoflurane (gray bars). *,
Significantly (P < .05) different from the control
values; † significantly (P < .05) different
from 0.6 MAC. (Adapted from Gare M, Schwabe DA, Hettrick DA, et al: Desflurane,
sevoflurane, and isoflurane affect left atrial active and passive mechanical properties
and impair left atrial-left ventricular coupling in vivo: Analysis using pressure-volume
relations. Anesthesiology 95:689–698, 2001.)

