|
|
|
|
|
|
|
|
|
|
|
|
|
|
|
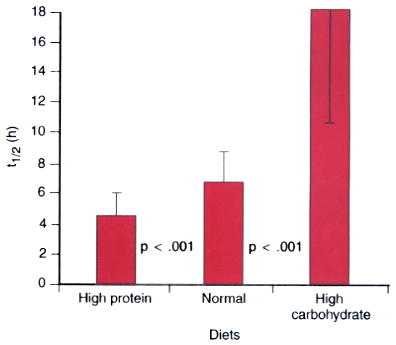
Figure 77-23
A comparison of theophylline half-life results during
test diet periods. Bars represent means ±
SD. (Adapted from Feldman CH, Hutchinson VE, Pippenger CH, et al: Effect
of dietary protein and carbohydrate on theophylline metabolism in children. Pediatrics
66:956, 1980.)

|
|
|
|
|
|
|
|
|
|
|
|
|
|