 |
|
|
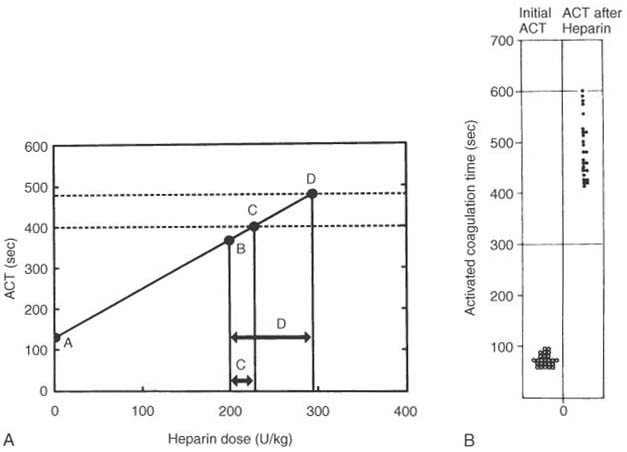
Figure 50-33
A, The pioneering work
of Bull and colleagues showing a dose-response curve wherein a patient's baseline
activated coagulation time (ACT) is demonstrated at point A. Initial heparin dosing
of 200 IU produced an ACT of greater than 350 seconds, and the dose-response curve
was drawn with an intersection at 400 (A) and 480 seconds (B). From these intersects
one can determine what further dose to administer to patients. Although this represents
the classic method described by Bull and colleagues, few centers have the time or
patience to wait for multiple doses of heparin to slowly creep up to the acceptable
ACT for bypass. B, The right
side of the illustration demonstrates the response of a population to a two-stage
dosing planned to give an ACT of 480 seconds. Note some significant scatter around
the 480-second number. (From Bull BS, Huse WM, Brauer FS, Korpman RA: Heparin
therapy during extracorporeal circulation: II. The use of a dose-response curve
to individualize heparin and protamine dosage. J Thorac Cardiovasc Surg 69:685–689,
1975.)
|
|