Valvular Dysfunction
TEE provides a highly reliable means for the assessment of valvular
structure and function. Although a comprehensive review of this topic is beyond
the scope of this chapter, a brief overview of the most commonly used techniques
should prepare the reader to fulfill at least
the requirements for basic TEE practice: to recognize gross valvular dysfunction.
When performing color Doppler in the following assessments, the operator should
use the minimum scan depth and maximum Nyquist limit possible.
The degree of aortic stenosis is easily appreciated in the ME
AV SAX cross section, where the extent of leaflet opening can be estimated visually
or measured directly with planimetry.[86]
Severe
stenosis is characterized by marked thickening of the leaflets and severely reduced
leaflet motion (valve opening area <1 cm2
). In the deep TG LAX cross
section, CW Doppler allows reliable estimation of the gradient across the AV ( Fig.
33-13
).[87]
In severe stenosis, the peak
instantaneous gradient will exceed 64 mm Hg (CW velocity exceeding 4 m/sec), provided
that cardiac output has not been markedly compromised. Noteworthy is the fact that
the echocardiographically derived AV gradient may be higher than the peak-to-peak
gradient reported from a catheterization study because the latter does not measure
the instantaneous gradient as Doppler echocardiography does. Additional information
on the morphology of the AV, including the dimensions of the annulus, sinotubular
junction, and ascending aorta, can be garnered from the ME AV LAX cross section.
The degree of aortic regurgitation is appreciated best in this cross section. With
color Doppler positioned over the leaflets and outflow track, aortic regurgitation
is recognized as a color jet emanating from the valve during diastole. Even
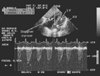 Figure 33-13
Continuous-wave Doppler estimation of the aortic valve
(AV) gradient. Continuous-wave Doppler measurement of blood flow velocities immediately
above the AV during seven cardiac cycles is shown. At the top of the figure is a
still-frame image of the two-dimensional cross section used to position the Doppler
sample cursor (the diagonal white line). On the
bottom two thirds of the figure is the display in white of the instantaneous blood
flow velocities (vertical axis) versus time (horizontal axis) occurring anywhere
along that cursor. The electrocardiogram provides timing, and the bold
horizontal line is the baseline (zero flow) for the flow velocities.
With this Doppler alignment, all flow velocities are negative (i.e., away from the
transducer). The Doppler scale has been set to a maximum of -629 cm/sec, and this
tracing documents significant aortic stenosis: a peak blood flow velocity of approximately
4 m/sec (each white dot on the vertical axis equals
100 cm/sec or 1 m/sec) corresponding to a peak gradient across the aortic valve of
64 mm Hg. (From Cahalan MK: Intraoperative Transesophageal Echocardiography.
An Interactive Text and Atlas. New York, Churchill Livingstone, 1997.)
Figure 33-13
Continuous-wave Doppler estimation of the aortic valve
(AV) gradient. Continuous-wave Doppler measurement of blood flow velocities immediately
above the AV during seven cardiac cycles is shown. At the top of the figure is a
still-frame image of the two-dimensional cross section used to position the Doppler
sample cursor (the diagonal white line). On the
bottom two thirds of the figure is the display in white of the instantaneous blood
flow velocities (vertical axis) versus time (horizontal axis) occurring anywhere
along that cursor. The electrocardiogram provides timing, and the bold
horizontal line is the baseline (zero flow) for the flow velocities.
With this Doppler alignment, all flow velocities are negative (i.e., away from the
transducer). The Doppler scale has been set to a maximum of -629 cm/sec, and this
tracing documents significant aortic stenosis: a peak blood flow velocity of approximately
4 m/sec (each white dot on the vertical axis equals
100 cm/sec or 1 m/sec) corresponding to a peak gradient across the aortic valve of
64 mm Hg. (From Cahalan MK: Intraoperative Transesophageal Echocardiography.
An Interactive Text and Atlas. New York, Churchill Livingstone, 1997.)
modest degrees of aortic regurgitation can be clinically significant during cardiac
surgery and produce LV distention during cardiopulmonary bypass, as well as diminish
the effectiveness of antegrade cardioplegia.[88]
Mild regurgitation is characterized by a narrow-based, diastolic color jet (<2
mm at its origin in the valve) that occupies less than a third of the cross-sectional
area of the LV outflow tract and extends minimally into the left ventricle (1 to
2 cm). Moderate regurgitation is a broader-based, diastolic color jet (3 to 5 mm)
that occupies less than two thirds of the cross-sectional area of the LV outflow
tract and extends moderately into the left ventricle (3 to 5 cm). Severe regurgitation
is a broad-based, diastolic color jet (>5 mm) occupying the entire LV outflow
tract and extending well into the left ventricle ( Table
33-6
).
The presence and severity of mitral stenosis are easily determined
with TEE by using the ME four-chamber, two-chamber, commissural, and/or LAX cross
section, as well as the basal TG SAX cross section. Two-dimensional imaging reveals
thickened leaflets that dome toward the left ventricle and open poorly. Color Doppler
reveals laminar flow acceleration into the stenotic orifice and a turbulent jet emerging
into the ventricle ( Plate 33-3
).
PW and CW Doppler traces display a characteristic flow pattern with increased peak
and mean velocities ( Fig. 33-14
).
Mathematical calculations from these traces, such as the pressure half-time, are
the most precise methods to assess the severity of mitral stenosis, and formulas
for these
TABLE 33-6 -- Simplified grading for aortic insufficiency
*
|
Jet Width at Origin (mm) |
Jet Area (% of LVOT) |
Jet Depth into LV (cm) |
|
Mild |
<2 |
<50 |
1–2 |
|
Moderate |
3–5 |
50–75 |
3–5 |
|
Severe |
>5 |
>75 |
>5 |
|
LV, left ventricle; LVOT, LV outflow tract. |
|
From Cahalan MK: Intraoperative Transesophageal Echocardiography:
An Interactive Text and Atlas. New York, Churchill Livingstone, 1996. |
*Diastolic
jet width is assessed with color Doppler in the five-chamber view at the closure
point of the aortic valve (the origin of the regurgitant jet). The transducer should
be repositioned until the origin of the jet is clearly imaged. Failure to image
the origin of the jet may lead to overestimation of its severity. Diastolic jet
area is assessed with color Doppler in the five-chamber view. % of LVOT is the percentage
of the LVOT occupied by the plume of the color jet (the area of turbulent flow depicted
by the mosaic of color pixels). This parameter is markedly affected by aortic diastolic
pressure. Failure to adjust color or two-dimensional gains correctly may lead to
underestimation or overestimation of the severity of the regurgitation. Color gain
should be set just below the level that results in random color sparkle, and two-dimensional
gains should be set at the minimum levels allowing adequate visualization of cardiac
structures. Diastolic jet depth is assessed with color Doppler in the five-chamber
view. The length of penetration of the jet from the LVOT into the LV is estimated
in centimeters. This parameter is also markedly affected by aortic diastolic pressure
and gain settings.
evaluations are built into the software of virtually every ultrasonograph.[89]
In addition to the signs noted earlier, severe mitral stenosis always causes marked
left atrial enlargement and left atrial spontaneous contrast. Spontaneous contrast
is a swirling, smokelike appearance of 1- to 2-mm densities not caused by exogenously
administered contrast agents but by aggregation of red cells in areas of low flow.
Whenever left atrial enlargement and spontaneous contrast are noted, thrombus in
the left atrium and, in particular, the left atrial appendage should be suspected
and examined for carefully.
The presence and severity of mitral regurgitation are evaluated
from the same cross sections used for evaluation of mitral stenosis and with the
same grading strategy used for aortic regurgitation ( Table
33-7
). Mild regurgitation is characterized by a narrow-based, systolic
color jet (<2 mm at its origin in the valve) that occupies less than 25% of the
left atrial cross-sectional area and extends less than half the distance to the posterior
wall of the left atrium. Moderate regurgitation is a broader-based, systolic color
jet (3 to 5 mm at its origin in the valve) occupying less than 50% of the left atrial
cross-sectional area and extending 50% to 90% of the distance to the posterior wall
of the left atrium. Severe regurgitation is a broad-based, systolic color jet (>5
mm) that occupies most of the left atrium and extends into the pulmonary veins and
left atrial appendage ( Fig. 33-15
).
Eccentrically directed jets of mitral regurgitation that hug the wall of the atrium
are generally associated with more severe valvular regurgitation than their cross-sectional
area might suggest ( Plate 33-4
).
Moreover, eccentrically directed jets usually point away from the defective leaflet
(i.e., laterally directed jets are generally associated with anterior leaflet defects
and medially directed jets with posterior leaflet defects), provided that the mechanism
of regurgitation is leaflet prolapse or flail.[90]
Severe mitral regurgitation is invariably associated with systolic reversal of pulmonary
venous inflow.[91]
The general guidelines listed
earlier are widely used, but many more criteria have been described for assessment
of mitral regurgitation.[92]
Most importantly,
the degree of regurgitation is exquisitely dependent on LV loading conditions. For
practical purposes, quantitative measures of regurgitation, for example, the regurgitant
orifice area based on the theory of proximal isovelocity surface area, are less often
used in the operating room because of time restriction.[49]
Pulmonary and tricuspid valve pathology is assessed in a fashion
analogous to that described for the aortic and mitral valves.