|
|
|
|
|
|
|
|
|
|
|
|
|
|
|
The maximum flow rates that can be achieved during pulmonary function testing maneuvers depend on three factors, each of which is highly influenced by the volume of the lung at the time. Foremost is the degree of effort, or the driving pressure generated by muscle contraction. The expiratory effort reflected by PEmax is maximum at high lung volumes near TLC and decreases as lung volume decreases (see Fig. 26-3 ). Conversely, PImax is achieved at low lung volumes near RV and diminishes at higher lung volumes.
A second important determinant of maximum flow is the elastic recoil pressure of the lung (PL). At all lung volumes from RV to TLC, the lung has a tendency to recoil inward ( Fig. 26-4 ). The PL therefore is greatest at TLC (25 to 30 cm H2 O) and lowest at RV (2 to 3 cm H2 O). The PL is opposed by the outward recoil pressure of the chest wall (Pcw), except at very high lung volumes. The recoil pressure of the respiratory system (Prs) is the algebraic sum of PL + Pcw. PL and Pcw are equal and opposite at a certain point (i.e., Prs = 0). This volume is the FRC that is the respiratory system's normal resting volume.
A third factor, which opposes the two driving pressures, is the resistance to flow provided by the airways. This airway resistance (Raw) is determined by the size of the airways. Because airways are largest at high lung volumes
 Figure 26-4
Elastic recoil pressures for the lung (PL
),
chest wall (PCW
), and total respiratory system (PRS
) are plotted
as a function of lung volume. FRC, functional residual capacity; RV, residual volume;
TLC, total lung capacity; VC, vital capacity.
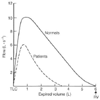
Because all determinants of maximum flow depend on lung volume, a useful format for assessing the flow-resistive properties of the airways is to plot flow as a function of volume during the FVC maneuver. At the beginning of the forced expiration, the rate of flow quickly rises to a maximum or peak value at a lung volume very near to
 Figure 26-5
The hyperbolic relationship of airway resistance (Raw)
to lung volume (A) is contrasted with the linear relationship
(B) of its reciprocal airway conductance (Gaw). FRC,
functional residual capacity; RV, residual volume; TLC, total lung capacity.
 Figure 26-6
Idealized maximum expiratory flow-volume curves for normal
subjects are contrasted with those typically seen for patients with obstructive airway
disease. Expiratory flow is plotted as a function of lung volume during maximum
expiration from total lung capacity (TLC) to residual volume (RV).
The influence of expiratory effort on the flow-volume curves is important. An individual can inscribe different flow-volume curves with different efforts, although each may have the same FVC. At large lung volumes close to TLC, air flow rises with increasing effort, as shown by curve A of Figure 26-7 . With decreasing effort, curves B and C exhibit decreased flows in this high range of lung volume,
 Figure 26-7
Forced expiratory flow-volume curves for a normal subject.
The exhalation from total lung capacity (TLC) to residual volume (RV) was performed
at three levels of effort: maximum (curve A), intermediate (curve B), and minimal
(curve C).
The rate of airflow during forced expiration is influenced by the effort expanded and by the lung volume at which the expiratory maneuver is begun. True maximum flows occur only when expiration is begun at or near TLC. When forced expirations are begun with maximum effort from volume below TLC ( Fig. 26-8 ), peak flow is not as high, but flows quickly conform to the same performance envelope as if the maneuvers were begun at TLC. Even some healthy subjects can exhibit a decreased FEV1 /FVC ratio on the normal volume-time spirogram when the forced expirations are started from such sub-maximal volumes. Therein lies some of the advantage of a flow-volume plot compared with the volume-time tracing with conventional spirometry.
|
|
|
|
|
|
|
|
|
|
|
|
|